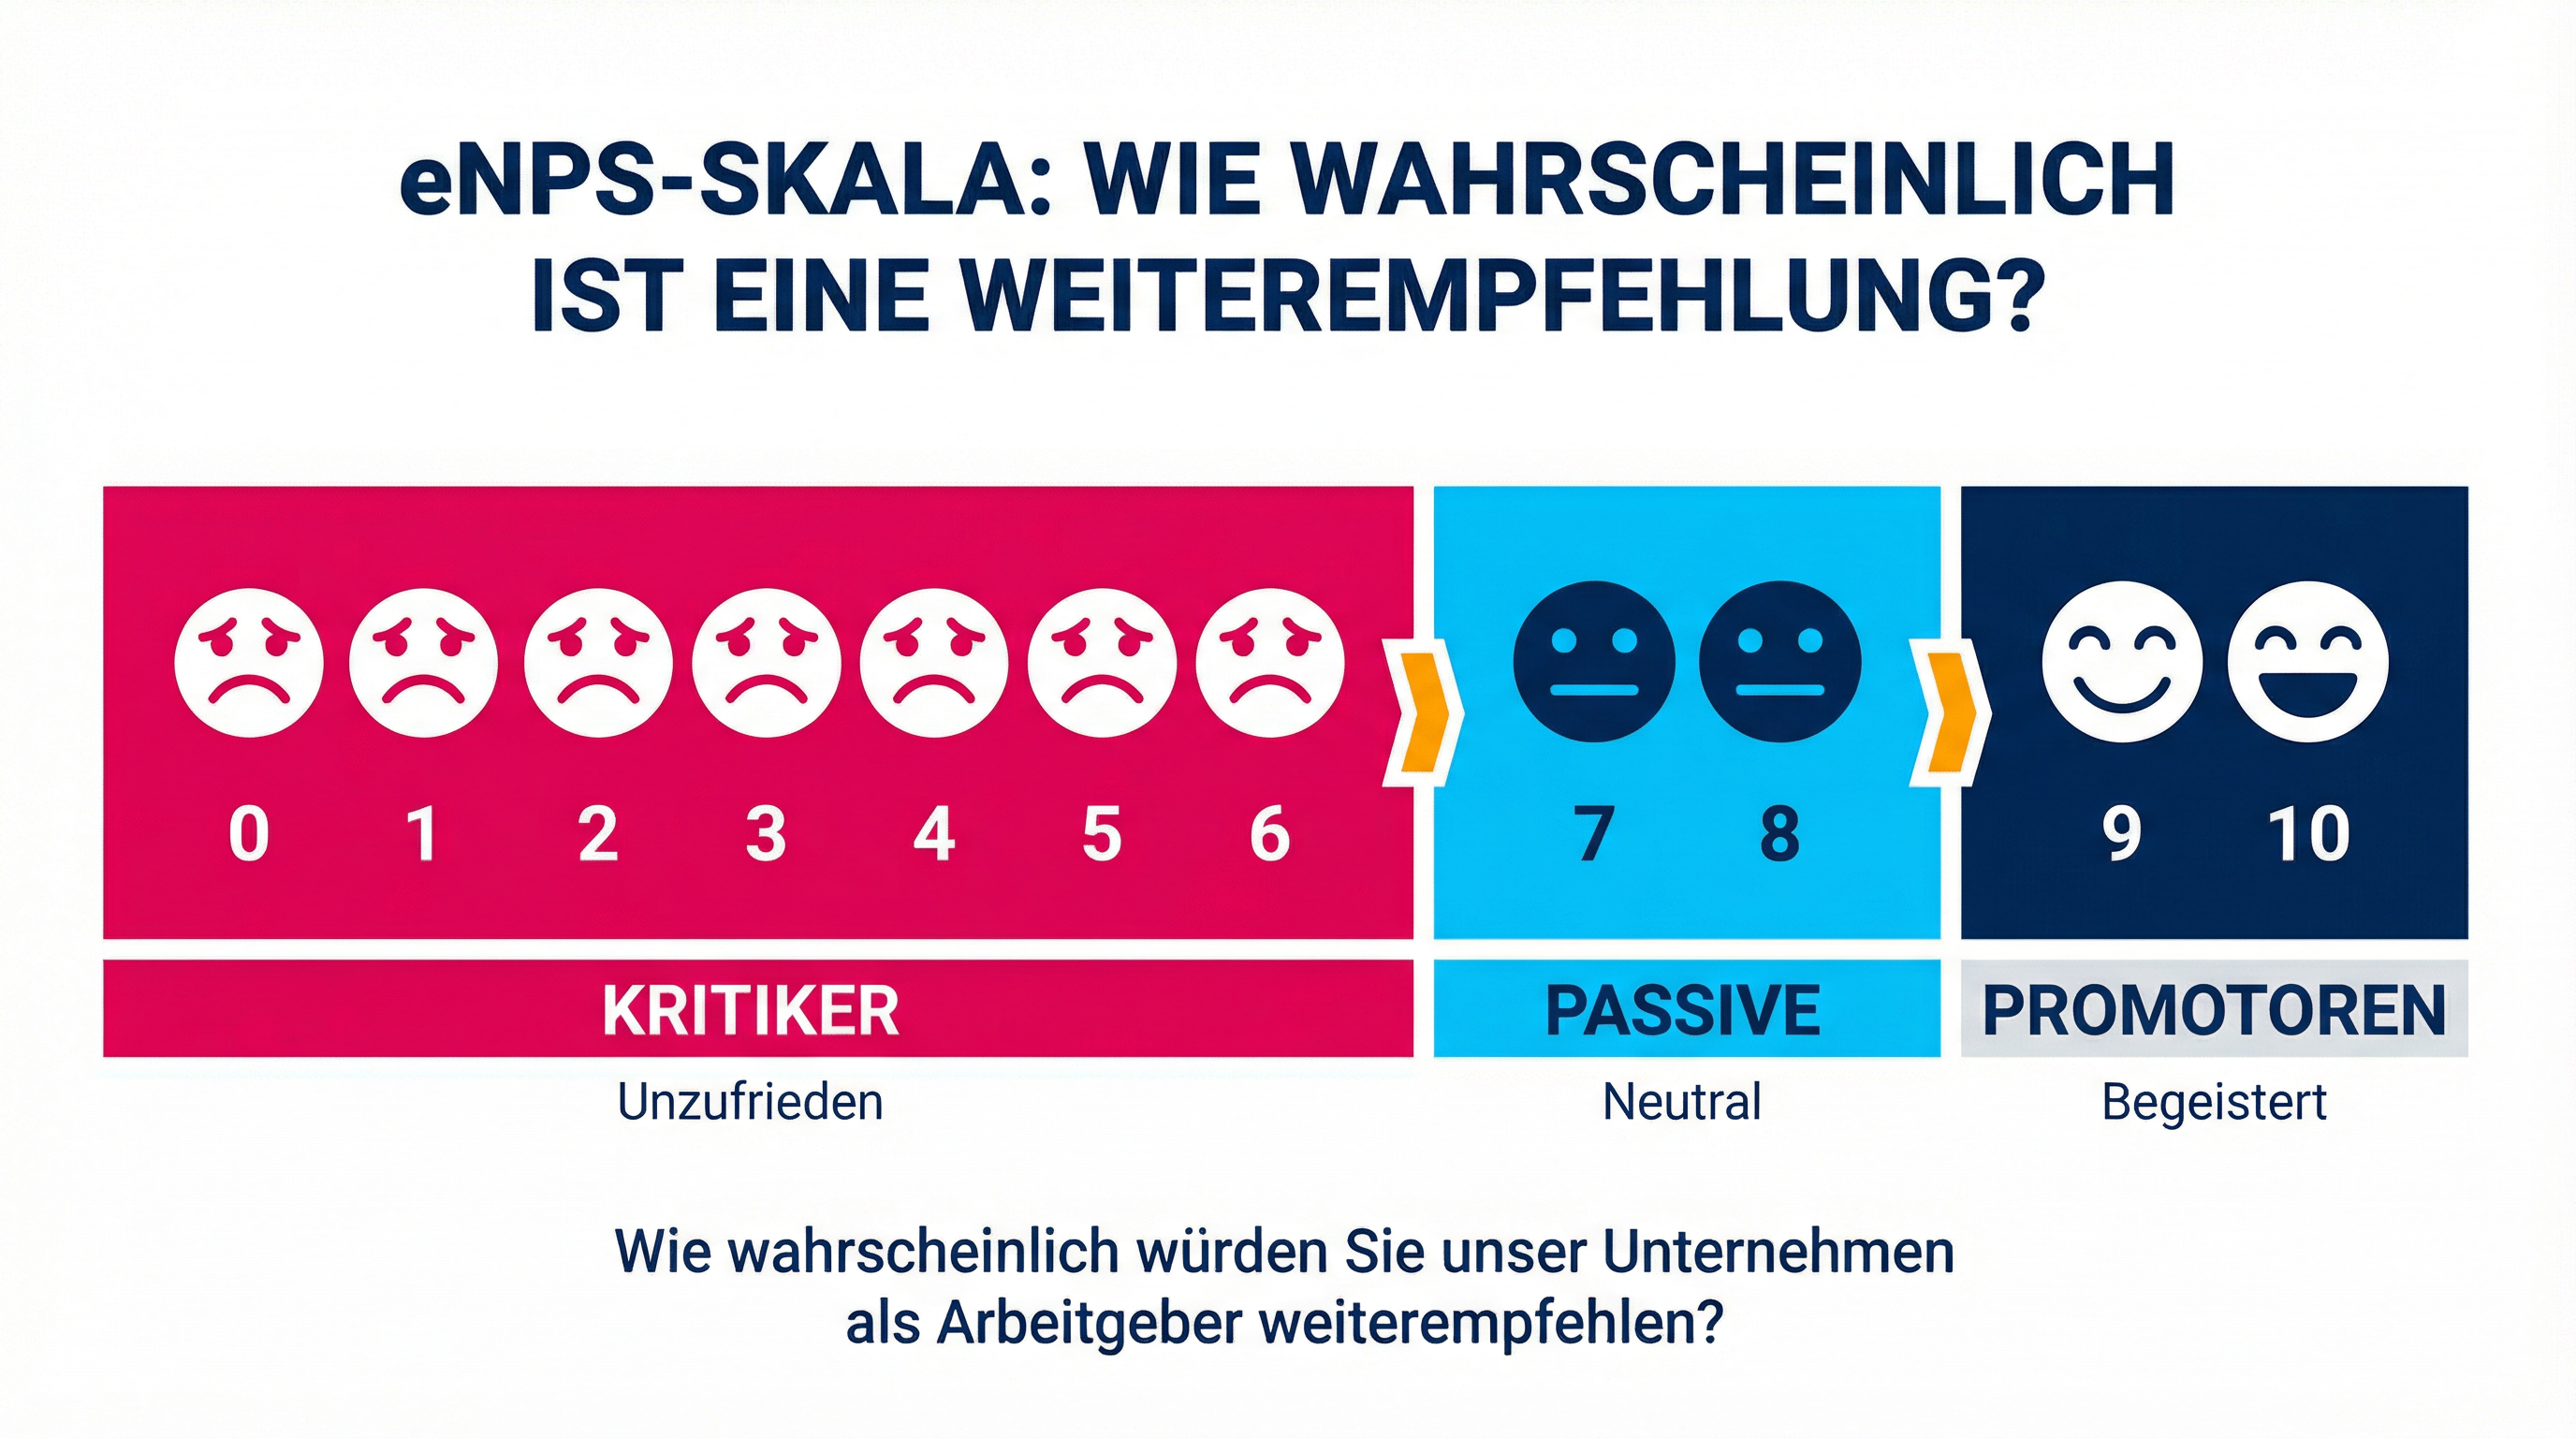
Today we are taking a closer look at one methodological aspect of surveys. In this article, we clarify questions relating to the topic of response scales, i.e. whether there is the right scale for a survey.
Is there the right scale for an employee survey?
We are often asked by our customers what the "right scale for an employee survey" is. It's mainly about the number of response categories and whether there should be a "don't know" or "no answer" response category.
Results from the online survey by ValueQuest
In an online survey, ValueQuest investigated how different forms of presentation influence the response behavior of employees. The employees surveyed were shown different variants of the scale at random. The following graphic shows the schematic representation of the different variants:
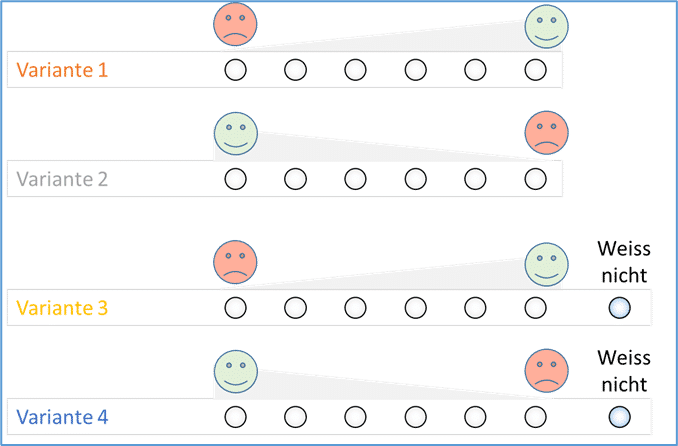
Fig. 1: Different response scales for employee surveys
In our online survey, we applied the selected variant to the entire questionnaire. The "Don't know" response category was not taken into account for the average.
If the assumption that the scale does not play a role were correct, the results would have to be statistically identical for all groups with approx. 170 respondents per variant. However, as the following graph shows, there were actually differences in response behavior, and quite consistently across all questions.
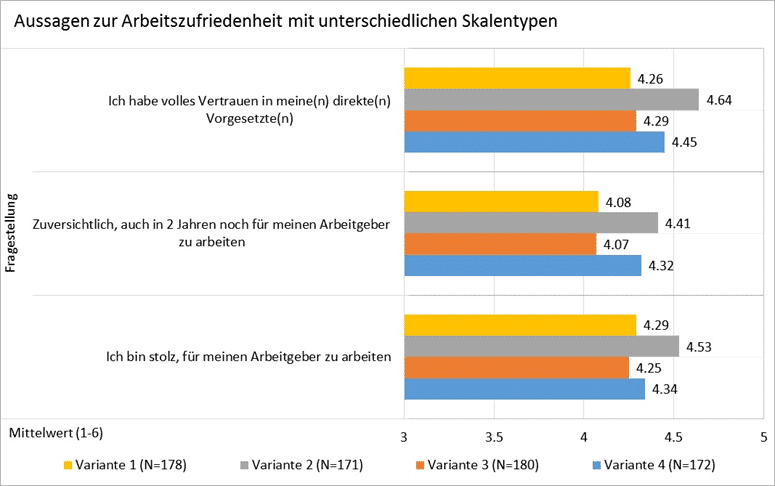
Fig. 2: Differences in response behavior for different scale types
Why do variant 2 (from right = bad to left = good) show the highest values? Respondents answer questions intuitively based on experience. They do not think long and hard about which score they want to give, but tend to answer on the left or right. There are therefore clear differences depending on the answer scale - this must be taken into account when creating questionnaires. Caution is also required when comparing with other studies.
In the two variants with the category "Don't know" (variants 3 and 4), there are only minor differences between variants 3 and 4. With regard to "Don't know" in general - i.e. tick "Don't know" if it is present or leave the question blank if "Don't know" is not present - there are hardly any differences between all variants. The number of "Don't knows" was around 2-3% in all four variants. The answer category "Don't know" therefore offers hardly any advantages over variants 1 and 2. We therefore usually recommend that our customers keep the questionnaire visually leaner and do without this option.
Conclusion on the different types of scales
The study shows that there are indeed differences between the various scales, but they are not very pronounced. It is important that the selected scale is retained within a questionnaire - otherwise this confuses the respondents and distorts the results. Cultural aspects also play a role. In Switzerland, scales are generally presented from left (bad) to right (good) (analogous to variant 1), while in Germany the scales tend to be presented from left (good) to right (bad) (analogous to variant 2).
Article published on June 30, 2021
About Francine Kräuchi

Francine Kräuchi is a senior manager and project manager at ValueQuest with many years of in-depth expertise in employee surveys and 360-degree leadership feedback. As a systemic coach, she supports managers in their further professional development based on the feedback results. Learn more about Francine
Inspired? Then share this post via your favorite platform.
Other articles that might interest you ...

AI in the Swiss Insurance Market: What Insurers Can Learn from the Results
October 1, 2026
Reading time: 4 min
Artificial intelligence is not universally accepted in the Swiss insurance market. As a study by ValueQuest shows, customers’ openness to AI depends heavily on how it is used.

AI in the Swiss Insurance Market: Between Acceptance and Skepticism
September 28, 2026
Reading time: 5 min
For many Swiss people, artificial intelligence has become an integral part of everyday life. However, the situation is different when it comes to insurance companies.

Top Employer: Raiffeisenbank Glarnerland Impresses with Strong Leadership
September 21, 2026
Reading time: 2 min
ValueQuest recently had the honor of presenting the “Excellence@Work Award” to Raiffeisenbank Glarnerland. We extend our heartfelt congratulations.
Top Swiss Employers: GastroSocial
September 9, 2026
Reading time: 3 min
GastroSocial has received the 2026 Excellence@Work Award from ValueQuest. With a response rate of 96 percent, a motivation score of 84, and 87 percent of employees serving as brand ambassadors, the company demonstrates a strong employer culture.

Employee Survey: Raiffeisenbank Möhlin Achieves Excellent Results
August 31, 2026
Reading time: 3 min
Raiffeisenbank Möhlin is one of Switzerland's top employers and is receiving our Excellence@Work Award in recognition of this achievement. Congratulations!

Employee Surveys in Switzerland: Find Providers & Tools
August 30, 2026
Reading time: 6 min
Employee Survey in Switzerland: How Do You Find the Right Employee Survey Provider? What Really Matters When It Comes to Anonymity, Tools, Questionnaires, and Analysis.

360-Degree Feedback Questionnaire: Sample, Template, and Sample Questions
August 21, 2026
Reading time: 7 min
Table of Contents A 360-degree feedback process is only as good as its questionnaire. The questionnaire is at the heart of the entire process. It determines whether...

Employee Survey: The CAMPUS SURSEE Foundation Is Among Switzerland's Best Employers
August 5, 2026
Reading time: 2 min
ValueQuest honors particularly attractive employers in Switzerland with the Excellence@Work Award. We recently had the pleasure of presenting the award to the CAMPUS SURSEE Foundation.
Raiffeisenbank Regio Arbon, a Top Employer: Personal Responsibility as Part of a Strong Corporate Culture
July 7, 2026
Reading time: 2 min
ValueQuest honors particularly attractive employers in Switzerland with the Excellence@Work Award. We recently had the pleasure of presenting the award to Raiffeisenbank Regio Arbon.